SLA, SLO, SLI: Cutting Through the Jargon
These three terms are used interchangeably in many organisations, but they describe fundamentally different things. Confusing them leads to contracts that sound impressive but provide no operational value, and to engineering teams that optimise for the wrong metrics.
A Service Level Indicator (SLI) is a quantitative measurement of some aspect of the service. It is a number you can observe and record: the proportion of HTTP requests that return within 200 milliseconds, the percentage of scheduled jobs that complete successfully, the fraction of time that a storage system is accessible. SLIs are the raw data—the objective measurements that describe how the system is actually behaving.
A Service Level Objective (SLO) is a target value or range for an SLI. It is an internal commitment that says: "We aim for this level of performance." For example, "99.5% of API requests will complete within 300 ms, measured over a rolling 28-day window." SLOs are chosen based on what users need, what the system can realistically deliver, and how much engineering effort the organisation is willing to invest in reliability.
A Service Level Agreement (SLA) is a contract between a service provider and a customer that specifies consequences for failing to meet certain thresholds. SLAs typically reference SLOs but with lower targets, because the contractual consequences (service credits, penalty payments, contract termination rights) make them inherently conservative. An SLA that promises 99.9% availability when the internal SLO is 99.95% gives the operations team a buffer between "we need to investigate" and "we owe the customer money."
An SLA without underlying SLOs is a guess. An SLO without underlying SLIs is a wish. Start with what you can measure, then decide what good looks like, then negotiate what you are willing to guarantee.
How Error Budgets Create a Rational Change Policy
The concept of an error budget transforms SLOs from passive monitoring targets into active decision-making tools. The logic is elegantly simple: if your SLO is 99.5% availability over 28 days, then your error budget is 0.5%—approximately 3.4 hours of allowable downtime per month.
When the error budget is healthy (plenty of remaining budget), the team has room to take risks: deploy new features, run infrastructure upgrades, experiment with configuration changes. When the error budget is low or exhausted, the team shifts to conservative mode: only critical fixes are deployed, changes require additional review, and engineering focus shifts to reliability improvements.
This framework resolves one of the most common tensions in platform operations: the conflict between velocity (shipping changes quickly) and stability (keeping the system reliable). Without error budgets, this tension is resolved through political negotiation or, worse, through crisis-driven decision-making after an outage. With error budgets, the decision is data-driven. The budget tells you whether you can afford to take risks right now.
For research platforms specifically, error budgets provide an additional benefit: they make maintenance windows and planned changes accountable. A maintenance window that consumes 30 minutes of the error budget is no longer "free"—it is a deliberate expenditure that the team chooses to make, knowing it reduces the remaining capacity for unplanned incidents.
Implementing Error Budgets in Practice
- Define a measurement window. Rolling 28-day or 30-day windows are standard. Calendar-month windows create perverse incentives at month boundaries.
- Automate budget calculation. Error budget remaining should be visible on a dashboard that the operations team checks daily. Manual calculation does not scale and is prone to error.
- Establish escalation thresholds. At 50% budget consumed, increase change review rigor. At 75%, freeze non-critical changes. At 100%, enter incident-response mode until the budget recovers.
- Review budget consumption monthly. Classify budget expenditure as planned (maintenance, upgrades) or unplanned (incidents, failures). Track the ratio over time. A healthy platform spends most of its error budget on planned activities.
Example SLOs for R&D Environments
Research platforms have different reliability requirements than customer-facing web services. A 30-second latency spike on a genomics analysis platform is invisible to users; the same spike on an e-commerce checkout page costs revenue. SLOs must be calibrated to what actually matters for the users of the platform.
| SLO Category | Indicator (SLI) | Target | Measurement Window |
|---|---|---|---|
| Platform Availability | Percentage of time compute nodes are accessible and accepting jobs | ≥ 99.5% | Rolling 28 days |
| Job Throughput | Percentage of submitted jobs that start within 15 minutes of submission | ≥ 95% | Rolling 28 days |
| Job Completion | Percentage of started jobs that complete without infrastructure-caused failure | ≥ 99% | Rolling 28 days |
| Data Access Latency | P95 latency for read operations on the shared research filesystem | ≤ 50 ms | Rolling 7 days |
| Storage Availability | Percentage of time primary storage is accessible for read/write operations | ≥ 99.9% | Rolling 28 days |
These SLOs reflect the priorities of a research environment. Platform availability at 99.5% acknowledges that maintenance windows and hardware replacements are a reality, and that researchers can typically tolerate short periods of unavailability if they are communicated in advance. Job throughput at 95% recognises that queuing is sometimes necessary when the platform is under heavy load. Data access latency uses a 7-day window because storage performance issues tend to be acute rather than chronic, and a shorter window catches problems faster.
SLOs Researchers Actually Care About
The most common mistake in defining SLOs for research platforms is selecting indicators that are easy to measure rather than indicators that reflect user experience. Researchers do not care about network uptime in the abstract. They care about whether their jobs run, whether their data is accessible, and whether results are available when expected. The SLOs above are structured around these user-facing concerns, not around infrastructure internals.
That said, internal SLIs—CPU temperature, disk error rates, network packet loss—are still valuable. They serve as leading indicators that predict user-facing SLO violations before they occur. The distinction is that internal SLIs feed engineering dashboards, while user-facing SLOs feed stakeholder reporting.
Reporting Formats That Procurement Teams Understand
SLO reporting for procurement and management audiences requires a different format than engineering dashboards. The goal is to convey platform reliability in terms that non-technical stakeholders can evaluate and compare across vendors.
Effective SLO reports for procurement include:
- Executive summary: A single-page view showing each SLO, its target, its actual performance over the reporting period, and whether the target was met. Use red/amber/green status indicators sparingly—they are useful but can oversimplify.
- Error budget status: For each SLO, show the error budget remaining as a percentage and as absolute time. "2.1 hours of budget remaining out of 3.4 hours" is more meaningful than "62% budget remaining" because it conveys the operational margin in concrete terms.
- Incident log: A table of incidents that consumed error budget, with duration, root cause category, and remediation status. This demonstrates that budget consumption is understood and managed, not ignored.
- Trend analysis: Show SLO performance over the trailing 3 to 6 months. Improving trends build confidence; deteriorating trends require explanation and a remediation plan.
- Planned maintenance impact: Separate planned downtime from unplanned incidents. This matters because planned maintenance demonstrates proactive management, while unplanned incidents indicate reliability gaps.
When comparing vendors, procurement teams should ask for historical SLO performance data, not just contractual SLA commitments. A vendor that promises 99.9% in the contract but has historically delivered 99.2% is a higher risk than a vendor that promises 99.5% and consistently delivers 99.7%.
SLOs tied to user experience drive better decisions than vanity SLAs. Define what researchers actually need—job throughput, data access latency, platform availability—set realistic targets, implement error budgets, and report performance in formats that procurement teams can evaluate. The result is a reliability practice that serves both engineering and business objectives.
Good SLOs are not about achieving perfect uptime. They are about making reliability a deliberate, measurable, and accountable discipline—one that balances the need for change with the need for stability, and that gives every stakeholder a shared understanding of what "good enough" looks like.
References & Further Reading
- EU GMP Annex 11: Computerised Systems Backup/restore checks, incident management, business continuity, and periodic evaluation requirements for regulated systems.
- Google SRE Workbook: Implementing SLOs Practical guide to defining service level objectives, error budgets, and alerting on SLOs for production systems.
- Prometheus: Alerting Best Practices Guidance on symptom-based alerting, reducing noise, and designing actionable alert rules.
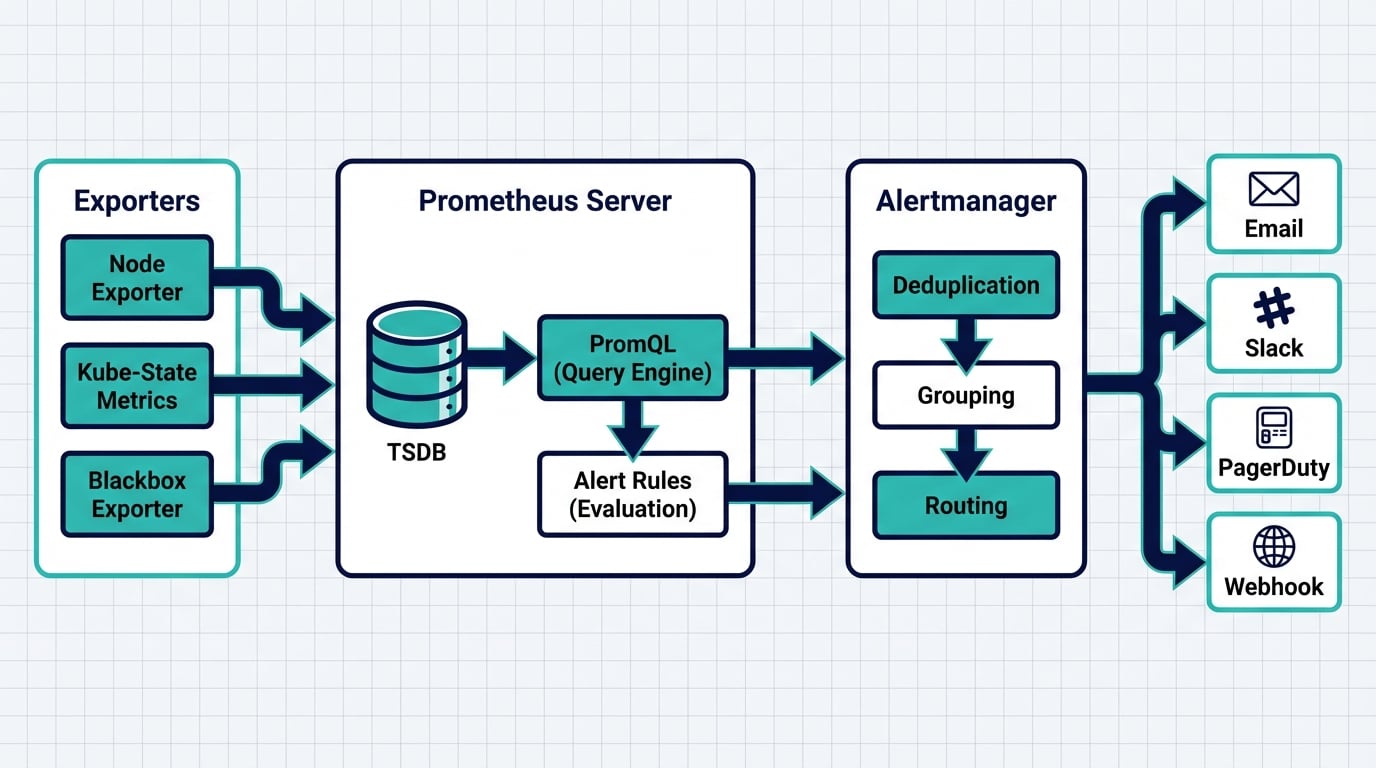
- Prometheus Alertmanager Overview Architecture documentation for alert routing, deduplication, grouping, and notification management.
- OpenTelemetry Documentation Vendor-neutral observability framework for correlated logs, metrics, and traces — useful for audit and troubleshooting.