Symptom-Based vs Cause-Based Alerting
The most common reason monitoring systems generate excessive noise is that they alert on causes rather than symptoms. This distinction is fundamental to building observability that serves the operations team rather than overwhelming it.
Cause-based alerting fires when an internal system metric crosses a threshold. CPU usage exceeds 90%. Disk usage passes 80%. A process restarts. Memory allocation spikes. These alerts describe what is happening inside the system, but they do not necessarily indicate that users are affected. A CPU running at 95% during a heavy batch job may be performing exactly as designed. A process that restarts cleanly and resumes service within seconds may not represent a user-visible problem.
The result of cause-based alerting is a high volume of alerts, many of which require investigation but lead to no action. Over time, operators learn to ignore or quickly dismiss alerts, creating alert fatigue—a condition where the signal-to-noise ratio is so poor that genuine incidents are missed or responded to slowly because they are buried in a stream of false positives.
Symptom-based alerting fires when user-visible behaviour degrades. API response times exceed the SLO threshold. Job failure rates increase beyond the error budget burn rate. Data access latency spikes above the level that affects researcher productivity. These alerts describe what users are experiencing, and every alert that fires requires action because it indicates a real problem.
The shift from cause-based to symptom-based alerting does not mean abandoning internal metrics. Internal metrics remain essential for diagnosis—once a symptom-based alert fires, the operations team uses internal metrics to identify the root cause. The change is in what triggers the pager. Symptoms trigger alerts; causes populate dashboards that are consulted during investigation.
The test of a good alert is simple: when it fires, does someone need to take action right now? If the answer is "maybe" or "it depends," it should be a dashboard metric, not an alert.
Prometheus and Alertmanager Architecture
Prometheus has become the de facto standard for metrics collection in modern infrastructure, and for good reason. Its pull-based architecture, powerful query language (PromQL), and native integration with Alertmanager provide a coherent foundation for building the kind of symptom-based alerting described above.
How the Components Fit Together
The architecture is straightforward. Prometheus periodically scrapes metrics endpoints exposed by your applications and infrastructure components. It stores these time-series metrics in its local database, where they can be queried using PromQL. Alerting rules, defined in Prometheus configuration, evaluate PromQL expressions at regular intervals and generate alerts when conditions are met.
These alerts are forwarded to Alertmanager, which handles the operational aspects of alert delivery: deduplication (preventing the same alert from firing multiple times), grouping (combining related alerts into a single notification), silencing (suppressing known alerts during maintenance windows), and routing (sending different alerts to different teams or channels based on labels).
For regulated environments, this architecture provides several advantages:
- Alerting rules as code: All alerting rules are defined in version-controlled configuration files. Changes to alerting rules go through the same review and approval process as any other code change, creating an audit trail of who changed what and when.
- Reproducible configuration: The entire monitoring configuration can be rebuilt from source control. This supports disaster recovery, environment replication, and validation evidence.
- Separation of collection and notification: Prometheus handles what to measure and when to alert; Alertmanager handles how to notify. This separation makes it easy to adjust notification routing without affecting the alerting logic, and vice versa.
- Long-term storage integration: For regulatory retention requirements, Prometheus can be paired with long-term storage backends such as Thanos or Cortex, which provide durable storage of metrics data beyond Prometheus's default retention period.
Practical Alerting Rule Design
Effective alerting rules for regulated platforms follow a consistent pattern:
- Define the SLI as a PromQL expression. For example, the ratio of successful HTTP requests to total requests over a 5-minute window.
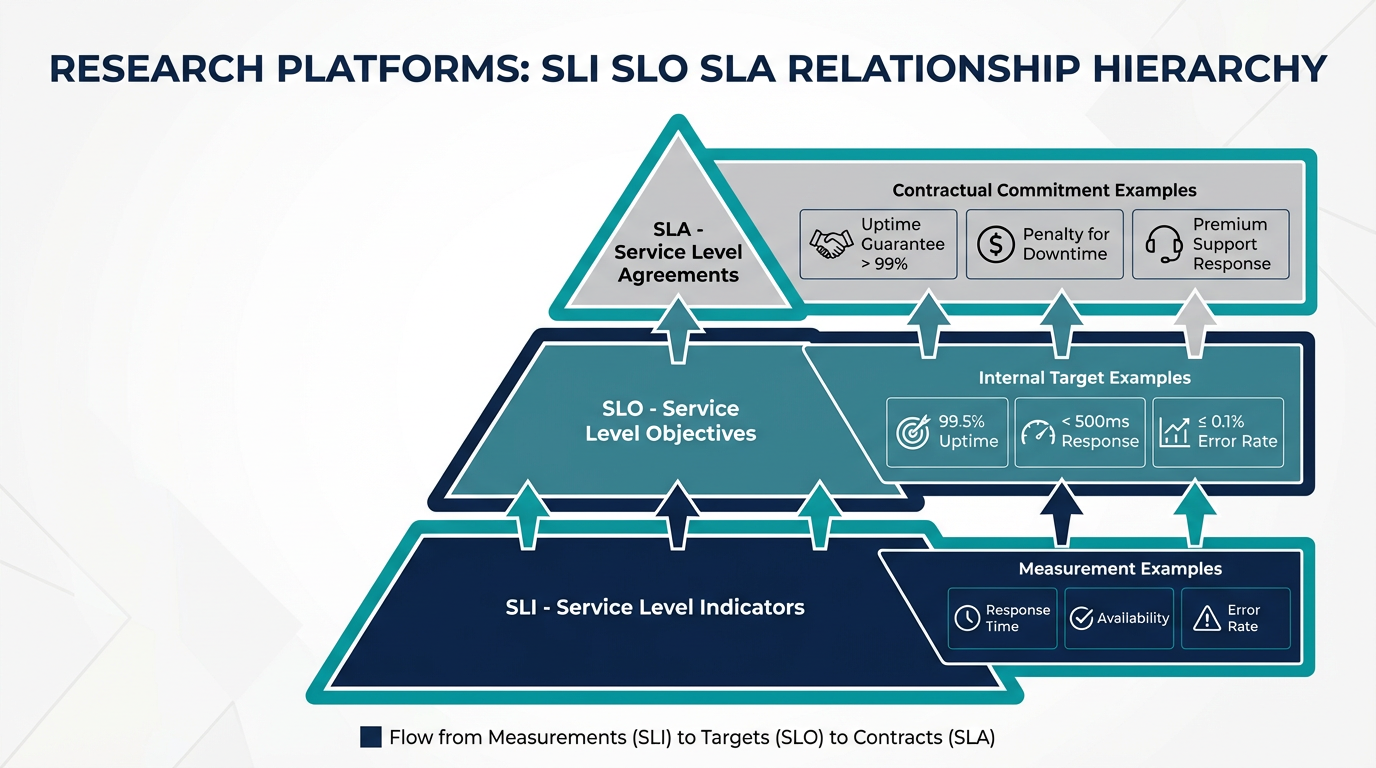
- Set the threshold based on the SLO. If the SLO is 99.5% success rate, alert when the measured rate drops below 99.5% for a sustained period.
- Use a "for" duration to prevent flapping. Require the condition to persist for at least 5 to 10 minutes before firing. This eliminates transient spikes that resolve before anyone could respond.
- Label alerts with severity and team. "Critical" alerts page the on-call engineer. "Warning" alerts create tickets for next-business-day investigation. Mislabelled severity is a primary cause of alert fatigue.
OpenTelemetry for Correlated Telemetry
Metrics alone tell you that something is wrong. To understand why, you need correlated telemetry: the ability to connect a metric anomaly to the specific traces, logs, and events that explain it. This is where OpenTelemetry (OTel) enters the picture.
OpenTelemetry is a vendor-neutral observability framework that provides standardised APIs, SDKs, and tooling for collecting and exporting three types of telemetry data:
- Metrics: Quantitative measurements over time (request counts, latency histograms, resource utilisation).
- Traces: End-to-end records of a request as it flows through distributed services, showing where time is spent and where errors occur.
- Logs: Timestamped text records of events, enriched with context from the trace that generated them.
The power of OpenTelemetry lies in correlation. When all three signal types share a common trace ID, an operator who receives a metric-based alert can pivot immediately to the specific traces that caused the anomaly, and from there to the specific log entries that describe the failure. This dramatically reduces the time from alert to root-cause identification—a metric known as Mean Time to Identify (MTTI).
For regulated platforms, correlated telemetry has an additional benefit: it produces naturally structured incident evidence. When an incident occurs, the correlated data—metrics showing the anomaly, traces showing the affected requests, logs showing the error details—forms a coherent narrative that can be packaged as part of the incident investigation record.
Building Incident Evidence Alongside Remediation
In regulated environments, incident response has a dual objective: restore service and produce evidence. The evidence requirement is not optional—auditors expect to see documented incident records that demonstrate the organisation detected the issue, responded appropriately, identified the root cause, and implemented corrective actions.
The challenge is that evidence collection and service restoration compete for the same resource: the attention of the operations team during a high-pressure situation. Teams that attempt to document incidents retrospectively—writing up the timeline and root-cause analysis hours or days after the event—produce incomplete and often inaccurate records. Details are forgotten, timestamps are approximated, and the causal chain is reconstructed from memory rather than data.
A more effective approach is to design the observability system so that evidence is produced automatically as a byproduct of normal incident response activities:
- Automated incident timelines: When an alert fires, automatically capture the alert details, the metric values that triggered it, and a link to the relevant dashboard. As the incident progresses, timestamped annotations from the operations team are appended to the same record.
- Snapshot dashboards: At the time of alert, automatically generate a snapshot of key dashboards showing the system state. This preserves the evidence that is otherwise lost as metrics age out of short-term storage.
- Correlated evidence packages: Using OpenTelemetry trace IDs, automatically collect the traces and logs associated with the incident. These form the technical evidence that supports the root-cause analysis.
- Post-incident review template: Provide a structured template that guides the team through documenting the timeline, root cause, impact assessment, and corrective actions. The template ensures consistency across incidents and satisfies the documentation expectations of auditors.
This approach does not add work to the incident response process. It restructures existing activities so that evidence is captured in real time, as part of the response, rather than reconstructed after the fact. The result is higher-quality evidence produced with less effort.
Good observability reduces alert fatigue AND produces audit-ready evidence. Build monitoring around symptoms, not causes. Use Prometheus and Alertmanager for structured, version-controlled alerting. Adopt OpenTelemetry for correlated telemetry that accelerates diagnosis. And design evidence collection into the incident response process itself—not as an afterthought that competes with restoration.
Observability is not a tool you install—it is a discipline you build. The organisations that get it right spend less time responding to false alarms, resolve real incidents faster, and walk into audits with evidence that demonstrates operational maturity rather than operational chaos.
References & Further Reading
- EU GMP Annex 11: Computerised Systems Backup/restore checks, incident management, business continuity, and periodic evaluation requirements for regulated systems.
- Google SRE Workbook: Implementing SLOs Practical guide to defining service level objectives, error budgets, and alerting on SLOs for production systems.
- Prometheus: Alerting Best Practices Guidance on symptom-based alerting, reducing noise, and designing actionable alert rules.
- Prometheus Alertmanager Overview Architecture documentation for alert routing, deduplication, grouping, and notification management.
- OpenTelemetry Documentation Vendor-neutral observability framework for correlated logs, metrics, and traces — useful for audit and troubleshooting.